


🏁 2025 NASCAR Cup Series Driver Rankings 🚗
Tracking the top drivers in the sport, all season long.


Throughout the 2025 NASCAR Cup Series season, I’ll be updating the following table to keep tabs on the fastest drivers in the sport, week in and week out. For more information about how it works, scroll down:
Navigate to…
If you just want the TL:DR? Every driver is assigned points based on how they finish, and I track their average points per race (relative to average) with weight also given to previous seasons — and also changing weights by track similarity — to predict performance at this week’s upcoming track.
As a new twist for 2025, the overall rankings are based on a rolling average of NASCAR’s official Driver Rating metric, with modifications for each track type.
🏁 2025 NASCAR Cup Series driver ratings 🚗
Update (Wednesday, May 7, 2025, 11:00 AM): The predicted track type ratings in the table have been adjusted to blend with the overall base rating in a way that would best predict the next race at that track type, rather than simply listing the track-type adjustments in isolation.
🏁 2025 NASCAR In-Season Challenge odds
How it works:
⛽ Rolling Driver Ratings
These ratings work in a fashion similar to the rolling NFL quarterback ratings I helped develop for FiveThirtyEight. Each driver is assigned a base rating and a track type-specific modified rating before each race, which are blended together to predict his or her Driver Rating in that race. After the race, the base and track type ratings are adjusted by weighting their actual driver rating from the race into their previous rating.
Specifically, each driver’s rating and modifier are updated via:
Rating_new = update_rate*race_Driver_Rating + (1 - update_rate)*Rating_old
The update rates are as follows:

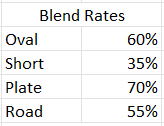
To make predictions before each race, we blend base ratings with track type-modified ratings like so:
Predicted_Driver_Rating = blend_rate*track_modifier + (1 - blend_rate)*base_rating
Here are the specific blend rates:
Finally, there are special rules for dealing with new drivers and transitions between seasons.
When a driver makes his or her debut (whether overall or on a particular track type), they are assigned a pre-race rating of 45.0 for their base and/or track modifier. To begin a new season, a driver’s base rating and modifiers for ovals and short tracks are simply their last rating from the previous season in each category, but we regress his/her restrictor plate modifier toward the mean of 70.0 by 25 percent, and their road-course modifier toward the mean of 70.0 by 5 percent.
⛽ In-Season Challenge and playoff advancement odds
To estimate each driver’s odds of advancing through the In-Season Challenge and/or NASCAR playoffs — and ultimately winning the title — I used a Monte Carlo simulation model powered by the aforementioned rolling track-type-adjusted driver ratings. For each round of the bracket, the model looks at the race’s track type and converts every driver’s projected rating into an expected finish percentile using a logistic regression trained on historical NASCAR data from Racing-Reference.info (dating back to 2005). This regression captures how well pre-race ratings typically correlate with actual finishing position, and the resulting percentile reflects the likelihood of a strong performance in that specific race’s context.
From there, I added a randomizing element to each driver’s expected performance based on the standard deviation of the residuals in the logistic regression — effectively simulating the week-to-week chaos and uncertainty that makes NASCAR so unpredictable. This random “noise” was drawn from a normal distribution, calibrated to the model’s historical error, and applied on the logit scale before being transformed back into a percentile. In a given race, the driver with the higher randomized percentile “wins” the matchup and advances in the bracket of the In-Season Challenge — or, for the playoffs, the entire field is rank-ordered by their randomized percentiles to simulate finishing positions.
This process was repeated 2,000 times to simulate a full playoff structure, generating win probabilities and round-by-round advancement odds for each driver. Because each race uses a different track type rating — including ovals, road courses, short tracks and “restrictor plate”/drafting-style superspeedways — the model properly accounts for driver strengths and weaknesses over the upcoming schedule.
⛽ Adjusted Points+ Index
One mainstay of this system is my Adjusted Points index (Pts+) metric. Adjusted Points gives credit to drivers for finishing in each position, based on the following curve:
The average of those points per race is then scaled relative to the Cup Series norm, so that an average driver is always 100.
⛽ Track Scouting Ratings
The driver rankings then look at this across multiple seasons, in the manner of the classic “Marcel” projection system. (I used a version of this for my 2024 NASCAR season preview as well.) The following weights are applied to a driver’s total races and Pts+ from each season:
2025 season weight: 6.0
2024 season weight: 2.4
2023 season weight: 1.2
2022 season weight: 0.4
The result is a rating that uses multiple seasons’ worth of data — giving more weight to 205 — while regressing small-sample drivers toward a low Pts+ index.
For this week’s track projections, I also use a 6-3-1 weighting scheme for each driver’s performance at each track, where races at that specific track receive a weight of 6, primary similar tracks get a weight of 3 and secondary similar tracks get a weight of 1. Those are combined with the recency weighting from the overall ratings to get ratings at each track. The “Diff.” category represents the gap between weighted projected performance at that track and the driver’s overall rating. (This will tell you who does better at this track than usual.)
📊 Historical NASCAR Data Spreadsheet
Similar to in the NBA, MLB and NHL, this season paid subscribers will have access to a constantly updating spreadsheet of NASCAR (primarily Cup Series) data, including yearly registers of Adjusted Points+ index, head-to-head W-L records between drivers and their teammates/similar grid cars/car manufacturers/etc. since 1972, and average Driver Rating (split by track type, etc.) and rolling driver ratings by race since 2005.
The link for this year’s sheet is below the paywall:
Keep reading with a 7-day free trial
Subscribe to Neil’s Substack to keep reading this post and get 7 days of free access to the full post archives.