


How Betting the Super Bowl Has Changed — And Why Closer Lines and Higher Totals Are Trending
For the 16th straight Super Bowl, the spread is less than 5 points.


🏈 Note: This story was a collaboration with Brian Wright of the excellent UndersClub Substack — please subscribe there to read more of his work!
Ever since there’s been the Super Bowl, there’s been Super Bowl betting. Both have grown significantly in size, popularity, and stature since they started out 59 years ago.
For all the tremendous hype and attention this game attracts, the spreads have been rather small lately. We haven’t seen a double-digit favorite since the 2007 season. In fact, each of the previous 15 Super Bowls have had spreads of 5 points or fewer — a trend that will continue with the Chiefs-Eagles matchup on Sunday at the Superdome (K.C. is currently favored by 1.5 points).
It wasn’t always this closely matched in the sportsbooks. At the beginning of the Super Bowl era, the perceived disparity in talent between the established NFL and the upstart AFL resulted in wide margins when the two football entities began facing off for the newfangled championship trophy in the late 1960s. For the first two games, this was proven out, as the NFL champ Green Bay Packers won by an average of 22 points. But Super Bowl III changed everything.
The AFL’s Jets entered as 18-point underdogs and left as champions over the NFL’s Colts. It was the first of 21 times that an underdog has won the Super Bowl outright — including three of the past four years. Kansas City followed up the Jets’ statement with one of its own the next year, and sent the AFL into the sunset with an upset victory over Minnesota as a 12-point underdog.
The merging of the two leagues meant a balancing of power and narrower Super Bowl spreads going forward. Only twice in the following 19 Super Bowls was there a spread in double-digits, and those were both 10-point lines.

Some pregame numbers during this span were curious in retrospect. When the Miami Dolphins won Super Bowl VII over Washington, they became the first — and, to this day, only — NFL team to go through the entire year unbeaten. Yet the odds for them to do so were narrow. Officially, the Dolphins were just 1-point favorites. Some pundits even gave Washington the edge, downplaying Miami’s undefeated record on the basis of schedule strength (or weakness, as the case may be).
The 1980s saw a tendency for books to be conservative with the spread. Take Super Bowl XVIII as an example, with Washington — the defending champions at 14-2 with the NFL’s highest-scoring offense to date — giving just 2 points. But maybe that was right. Whatever the number was, the Los Angeles Raiders obliterated it with a 38-9 demolition of the NFC winners.
The next year featured San Francisco and Miami. Many elements were on the 49ers’ side. They had a quarterback (Joe Montana) who had already won a Super Bowl, an offense that scored the league’s second-most points, a defense that gave up the fewest in the league, a record of 17 wins against just one loss, and they were essentially a home team playing the Super Bowl at Stanford Stadium in Palo Alto, CA. And yet, San Francisco was only a three-point favorite.
The following year would seem to have “mismatch” written all over it. The 15-1 Chicago Bears had little trouble going through the postseason, while the Wild Card 11-5 Patriots needed three road victories in the playoffs just to make Super Bowl XX. The game’s 37.5 point total might not be too surprising, as a testament to the historic ‘85 Bears defense, but Chicago giving 10 was certainly too small of a line in retrospect. Not much less dominant were the ‘86 Giants, who wound up being favored by only 9 against a Broncos team that ranked just ninth in point differential (+51) during the regular season.

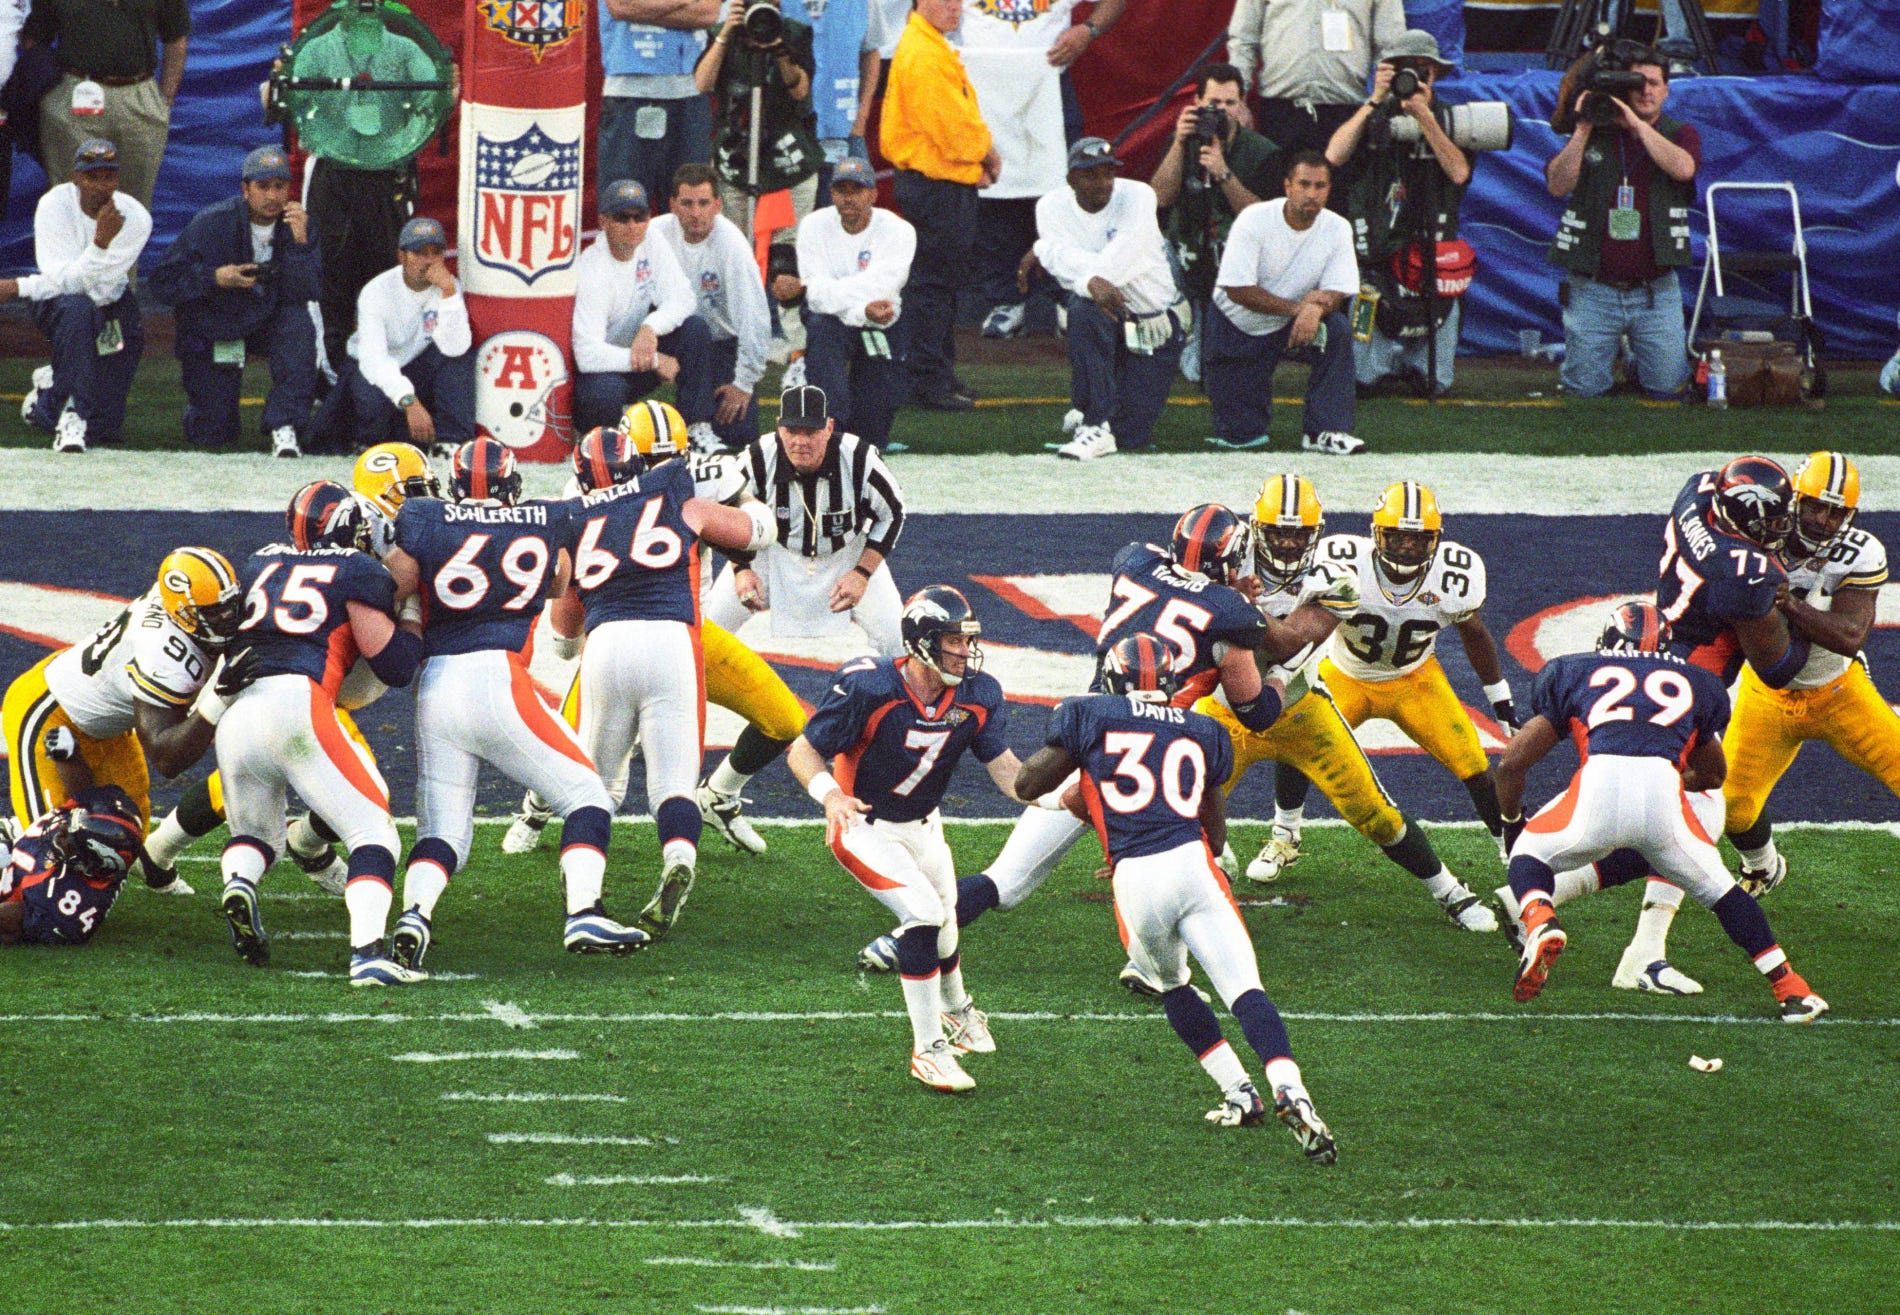
But the spell of the smaller-than-expected pregame Super Bowl line would eventually be broken. By the mid-1990s, spreads expanded into double-digits with regularity — a confirmation of the NFC’s dominance over the AFC, with the former beating the latter in 13 consecutive Super Bowls from 1984-1996. By 1997, the defending champion Green Bay Packers were certainly receiving an inflated number thanks to their conference’s preeminence. The opposing Wild Card Broncos got 11 points on the spread, but went 12-4 with the NFL’s top offense during the regular season led by All-Pro running back Terrell Davis who topped the league in touchdowns. Denver ended up covering the spread — and much more — by winning their first ring.
Since then, the books have wised up as they moved into the 21st century. Spreads have been smaller as parity has prevailed league-wide, with the average Super Bowl favorite giving just 4.6 points since the 1998 season:
There have been a few outliers in that span, exceptions to the rule of tightening pregame lines. The 2001 St. Louis Rams were 14-point favorites over the upstart New England Patriots, while the undefeated 2007 Patriots had come full circle to be 12.5-point favorites against the New York Giants. In both cases, the powerhouse team lost by 3 to the heavy underdog — and we haven’t seen a truly lopsided Super Bowl line since. Including this year, the average spread since the 2008 season is just 3.0 points. This remarkable 17-year stretch is by far the longest extended period of close Super Bowl spreads.
It’s tough to argue that this trend hasn’t made Super Bowl lines more accurate, in terms of predicting the final margin of the big game itself. We can judge the accuracy of point spreads over time by looking at the root mean squared error (RMSE) between the favorite’s pregame line (switching favorites to be positive) and their actual point margin in the game, where lower squared errors mean a more accurate forecast. (We square the error in order to penalize big misses more.)
If you look at the long-term picture, taking a rolling 10-year average to smooth out year-to-year variations, the bookmakers were relatively accurate early in Super Bowl history. But they became wildly inaccurate throughout most of the 1980s, during that era of smaller spreads but blowouts on the field. However, the pregame spreads got markedly more accurate as the 1990s progressed, settling into a relatively stable stretch since the 2000s, with a few periods of particularly accurate pregame lines during that span:
The decade from 2003-12 was the most accurate since the 1970s, mostly avoiding massive misses — with the exceptions of the 2007 Giants (noted above) and the 2009 New Orleans Saints, who were 4.5-point underdogs but ended up beating the Indianapolis Colts by 14. And even those were relatively small miscues by the standards of 1980s Super Bowl lines. Then, we have the most recent 10 years of completed Super Bowls, which ranks as the fourth-most accurate decade in the history of the big game — the only notable miss coming in the 2020 season, with the Tom Brady-led Tampa Bay Buccaneers beating the Chiefs by 22 as 3-point underdogs.
Point totals are a bit different, as they evolve with the characteristics of the teams and the changing nature of the sport itself. Overall, the pregame point total has been remarkably balanced. The under has hit 50.9 percent of the time, versus 49.1 percent for the over, though five of the past six Super Bowls have gone under. Before that, however, five of the previous six went over — as, again, these things have a tendency of balancing out.
A more eye-catching trend might just be the inflation of the point total as scoring increased in the NFL over time. The average over/under in Super Bowls II-XX (Pro-Football-Reference doesn’t have a point total for Super Bowl I) was just 38.8; now, it tends to hover around 50 more often than not. The first Super Bowl in PFR’s data to carry an over/under of 50? Super Bowl XIX between the 49ers and Dolphins, which had an unheard-of-for-the-time total of 53.5, beating the previous record of 48 from Super Bowls XVI and XVIII.
Fast-forward to the modern era. Over the past 32 Super Bowls, the total has been 50 or higher 15 times (47 percent), including exactly half the time in the past decade. (Interestingly, though, this year’s total looks like it will actually be below 50, despite opening at 50.5.)
As Super Bowl betting has changed over the years — moving from lopsided lines and low totals to razor-thin margins and rising over/unders — one thing is clear: oddsmakers are always adjusting, learning from past mistakes and refining their models, especially in recent decades. Sunday’s Chiefs-Eagles matchup is just the latest example of how modern Super Bowl spreads are now closer than ever. Whether the game itself follows suit, or delivers another unexpected twist, remains to be seen.
 | A guest post by
|