


A Note on Championship Leverage Index


(Note: This was originally published at Basketball Prospectus.)
I’ve used the concept of “Championship Leverage” a lot over the past year or so, but I realize that I’ve never really explained it very well. Here’s an attempt to correct that…
Championship Leverage obviously owes its name to the baseball stat invented by Tom Tango to measure the cruciality of a given base-out-inning situation. It starts with the win probability of each team in a series, given the current “state” of the series (home team in Game 4 up 2-1, road team in Game 6 down 3-2, etc.). The state of the series not only tells you how often each team can expect to win (assuming evenly-matched opponents with true .500 talent levels and a .600 home-court advantage), but also how much that probability can swing based on the outcome of the next game of the series, which in turn tells you the most important games in the series.
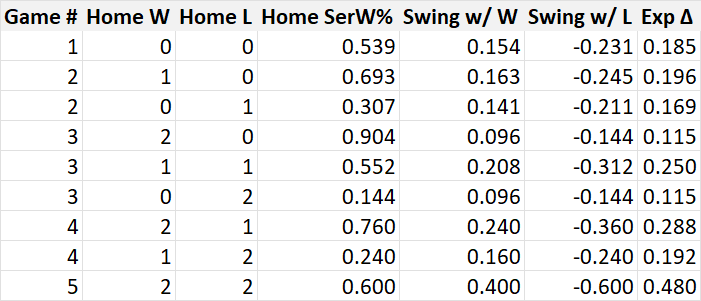
Here’s a table for a 2-2-1-1-1 best-of-7 series (”Exp Δ” means the expected swing in series win probability for the game, based on the home team having a 60% chance of winning the game):

Here is the same table, but for a 2-3-2 best-of-7 series:

And finally, a 2-2-1 best-of-5 series:
Using these numbers, you can measure how important a game is within a series. However, the “Championship” part of Championship Leverage involves also taking into account the playoff round in which the game took place. Again assuming each team is morally a .500 ballclub, your generic probability of a title before the 1st round would be 6.3% (1/16), which goes to 12.5% if you win, then 25%, then 50%, then 100% if you win the championship.
That’s where a table like this comes from:
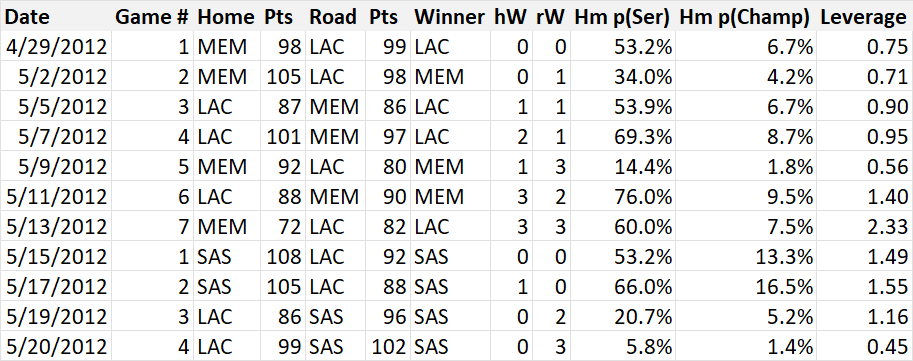
That’s the Clippers’ first 2 rounds of the playoffs. From “Hm p(Ser)”, you can see what the home team’s probability of winning the series was going into any given game (derived from the charts I listed above), which is multiplied by the generic probability of a championship if they won the series in question to arrive at “Hm p(Champ)”. Using that stat and the possible swings in Championship Probability with a win or a loss, you can calculate an “Exp Δ” stat at the championship level (rather than at the series level as we did before).
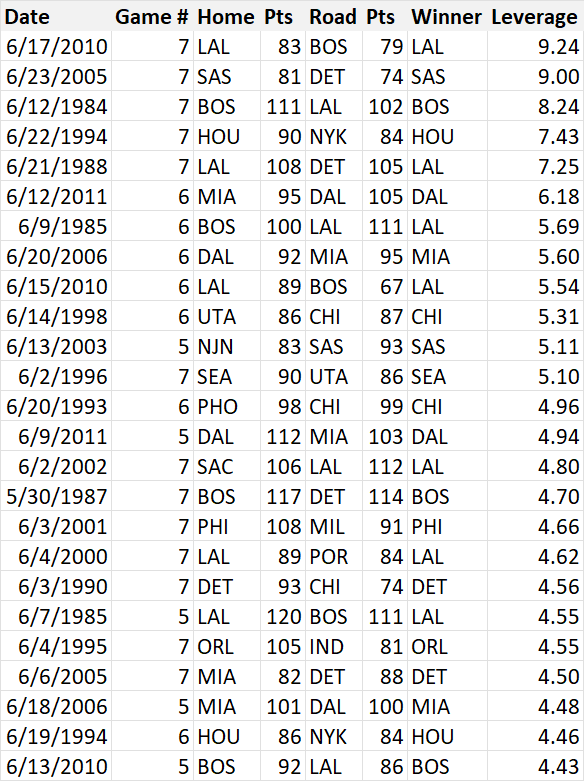
Once you’ve done that, calculate the average Exp Δ for every game in a given playoff season (the average in 2012 so far is 0.026; last year’s average was 0.047) and divide the game’s Exp Δ by the average Exp Δ across all games that year. The result is Championship Leverage Index, where 1.00 represents a game with an average impact on the championship (going back to our example, Game 7 of the Clippers-Grizzlies series had 2.3 times as much impact as the average game). Here are the highest-leverage games since the NBA went to a 16-team playoff in 1984:
By using Championship Leverage Index, you can weight team and player performances by the importance of the game itself. For instance, here are the team PPG margin leaders in this year’s playoffs, both raw and weighted by leverage:
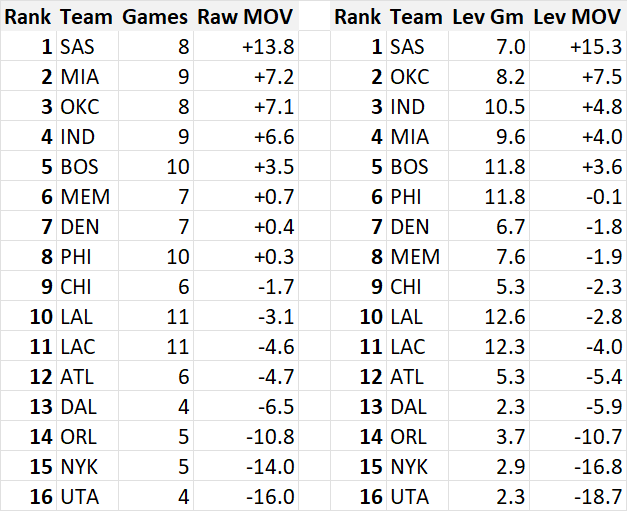
San Antonio leads both, but below them you see differences that are explained by the timing of each team’s good/bad performances. By playing better in less important games, Miami ranks lower in the leveraged MOV rankings than the raw ones, while teams like Oklahoma City and Indiana move up because more of their PPG differential was accrued in games that had more crucial implications. The difference between raw and leveraged MOV can even be turned into a “clutch” metric:

There are a lot of cool things you can do with a stat like this, and hopefully this served as a primer for those wanting to learn more about the Championship Leverage concept and how it’s calculated.
Filed under: NBA