What Out Of The Park Baseball 24 Thinks About The '23 Season
Yes, this was an excuse to run a bunch of simulations using the beloved video game franchise.
As I’m sure is the case for many nerdy baseball fans out there, Out Of The Park Baseball is probably the video game I’ve spent the most time playing over the past decade. There’s just something about baseball that lends itself to simulation games more than other sports, and it’s hard to find a simulation that is deeper and offers as wide an array of fun options as OOTP.
All of which is to say: In honor of Opening Day today, I thought it would be fun to use the newest version of OOTP to generate a bunch of simulated versions of the 2023 season and see who comes out on top most often. One of the few limitations of OOTP is that it isn’t terribly easy to sim a bunch of entire seasons at once (if you could call that a limitation — it’s not exactly the main purpose of the software), so I asked it to run exactly 24 parallel universes in honor of OOTP 24. Ideally, you’d like to run more, but the averages seemed pretty stable even after just 24 run-throughs, and I think we can still learn a thing or two from the results.
Here are the top-line averages from those 24 different simulated universes:
One of the big things that jumps out from the simulations is that only four teams (the Atlanta Braves, Los Angeles Dodgers, New York Mets and San Diego Padres) are predicted for more than 90 wins, which means OOTP has a slightly more constrained view of the talent distribution across teams than other projections. (The FiveThirtyEight model — itself a composite of other statistical systems — calls for six teams to win 90+, for instance.) But that doesn’t stop OOTP from loving the Braves’ chances, giving them a 98.8-win average that towers over most of the competition — the Dodgers are second at 95.5 wins.
Some other differences against 538 include:
The Rays are favored over the Yankees and Blue Jays in the AL East. The Red Sox and Orioles are somewhat closer to the top.
The Twins are favored over the Guardians in the AL Central.
The Astros aren’t as heavy favorites in the AL West. Their top competition is the Angels rather than the Mariners (though Seattle — and even Texas! — are certainly in the mix).
The Braves are much larger favorites over the Mets in the NL East. The Phillies might be due for disappointment after last year’s World Series run; the Marlins have a much lower projection as well.
The Cardinals, not the Brewers, are favored in the NL Central. The Cubs are further from contention than we thought.
The Dodgers have a slightly larger edge on the Padres in the NL West. The Diamondbacks, not the Giants, are the top threats to the top two.
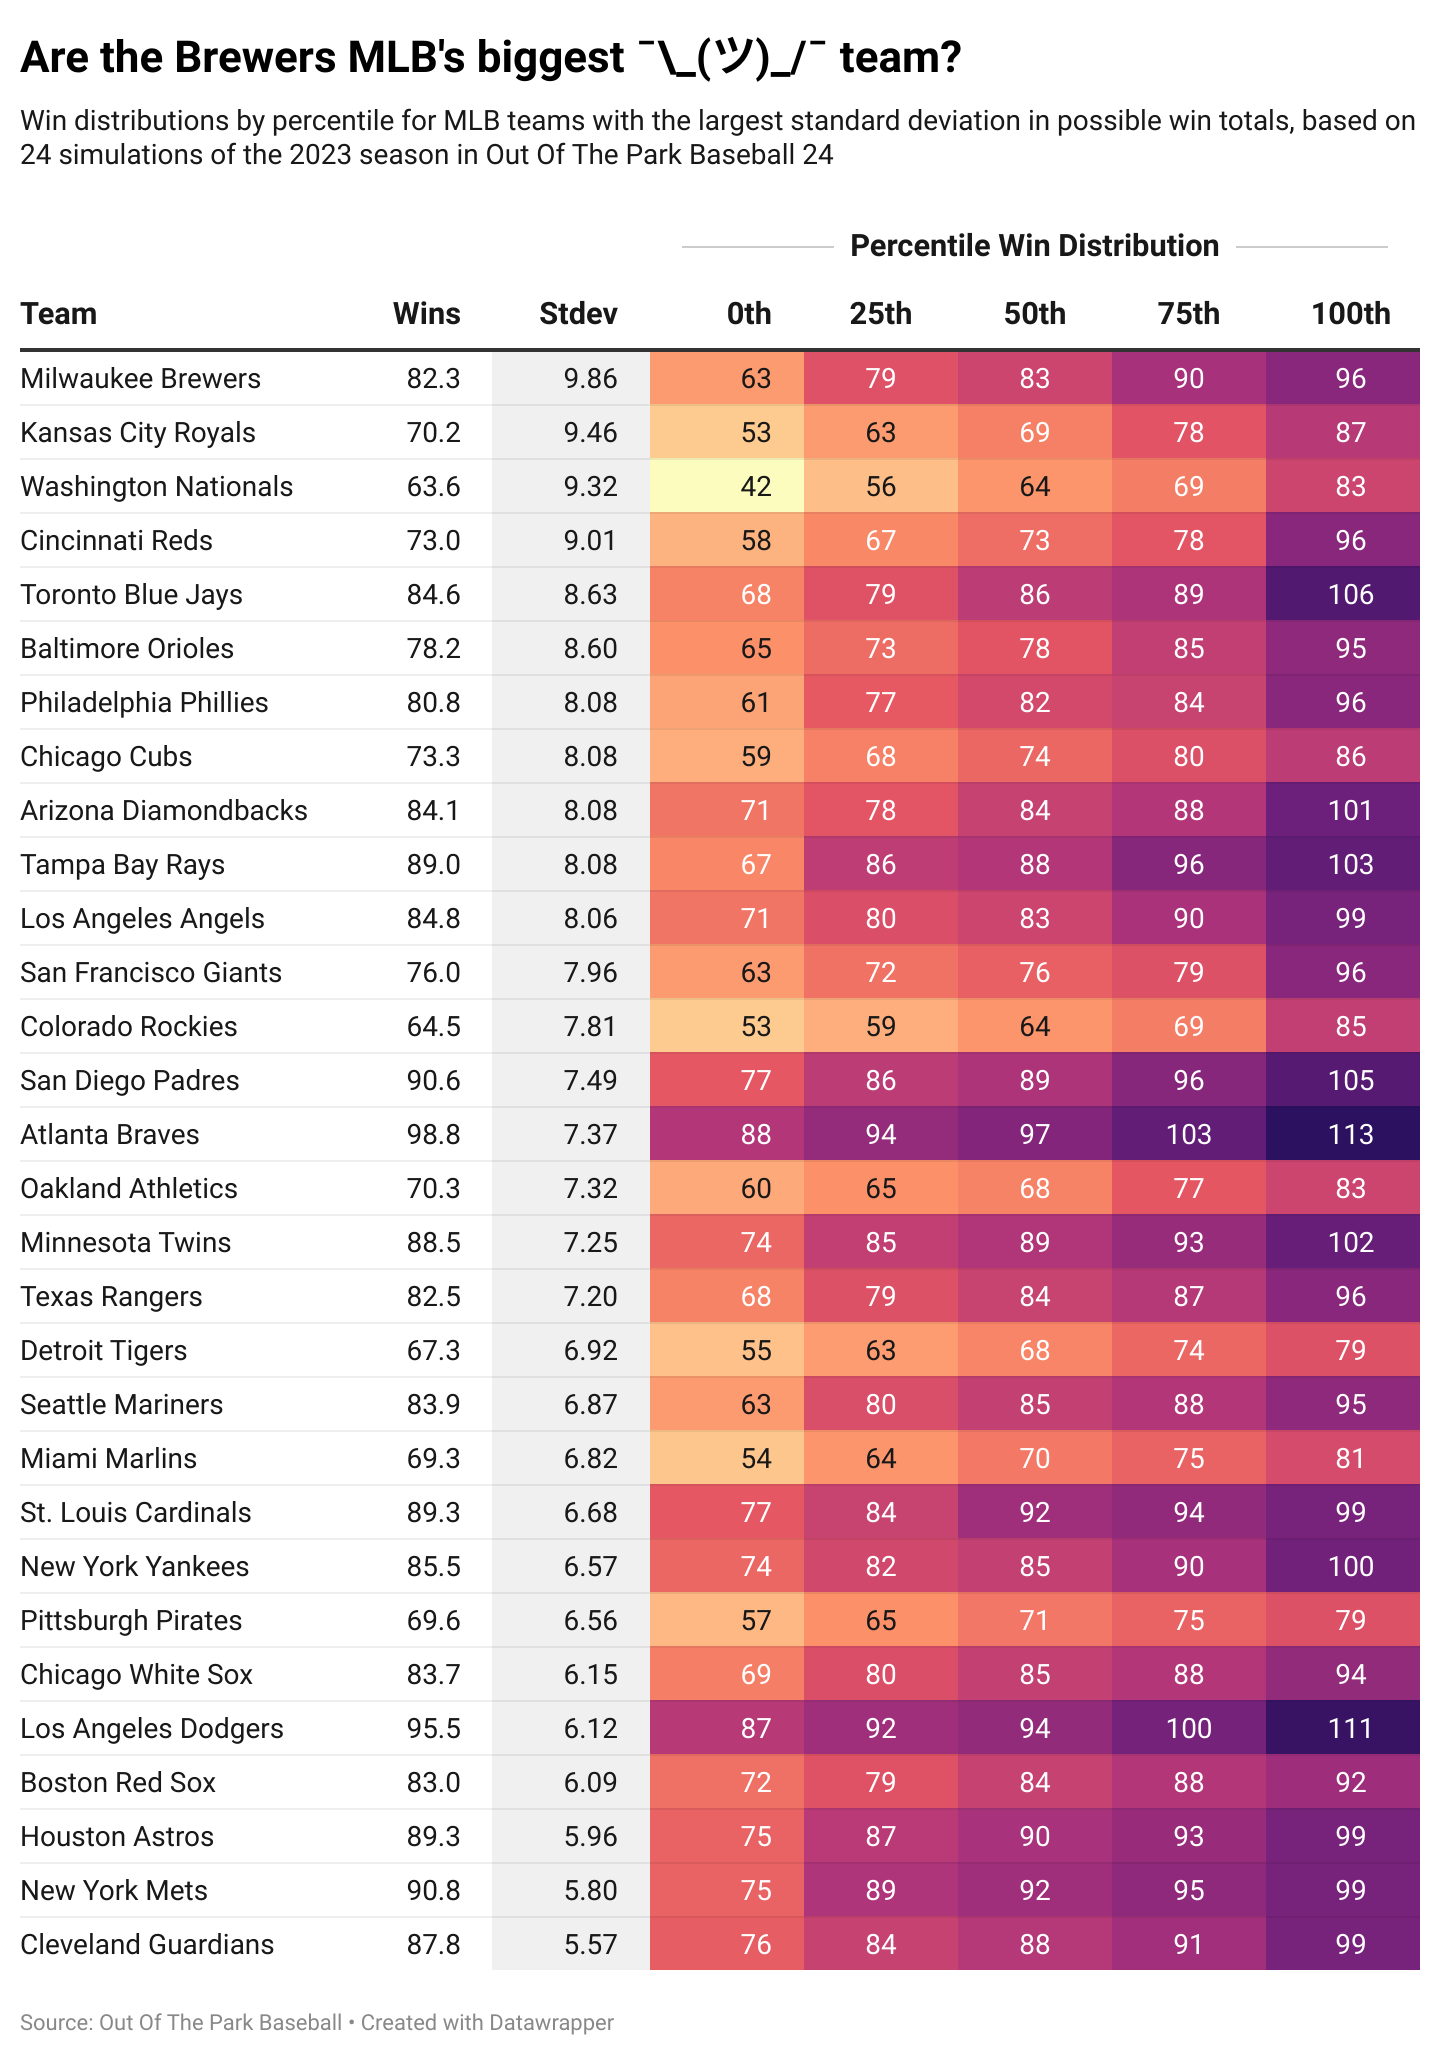
Another interesting thing we can pull out of the OOTP sims is the distributions of results by team across the different fictional universes. The Guardians, for example, were the most stable team in our 24 simulations, seldom deviating from the 84-91 win range. (The Mets were also extremely stable, mostly staying in the range of 89-95 wins.)
The Brewers, by contrast, were the wackiest team in the simulations, varying from as few as 63 wins on the low side to as many as 96 on the high side. Among all MLB teams, Milwaukee had the widest standard deviation of win predictions across the 24 simmed seasons:
Among other good (i.e., at or near .500 overall) teams, the Blue Jays, Orioles and Phillies were also notably volatile depending on which simulation you looked at. In Simulation #24, Toronto was dominant, going 106-56 with a +201 run differential; but in Simulation #22, they went 68-94 with a -69 run differential. We might not have any idea of what we’re getting from the Jays, but then again, what else is new?
(The division-rival Red Sox might be at the other end of the spectrum, with a very tight distribution of win totals that never rose above 92 in any simulation. But do we really think “Boston” and “predictable” make sense in the same sentence?)
Overall, I don’t know if I would take these predictions to Vegas and use them to bet on over/unders. However, I still think it’s really interesting to look at the variance in each team’s predictions and map it to which teams have the highest ceilings or lowest floors for 2023. OOTP might just be a video game, but it also puts you in the shoes of your real-life GM of choice, and in that capacity you have to live with the natural (and sometimes cruel) ups and downs of a sport that remains endearingly confounding to predict.


